Your whole farm on one map, one logbook per plot
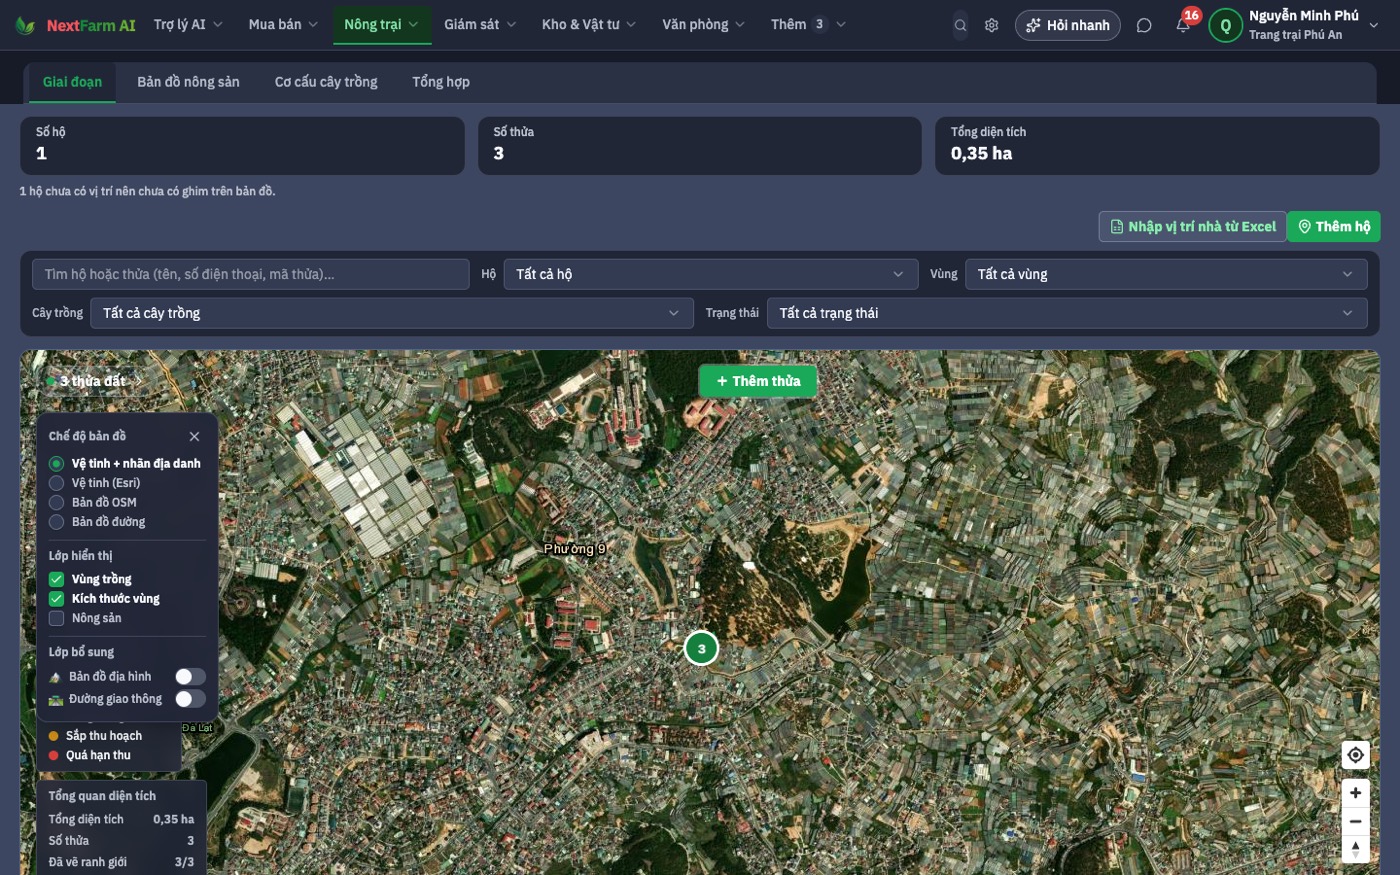
Draw fields, ponds and barns on satellite imagery. Each plot has its own seasons, logs, plans, harvests and costs.
- Crops, livestock and aquaculture in one place
- Logs work offline and sync when back online
- From plan to harvest to cost per lot
The situation today
Public figures — tap the small number to open the source.
>31%
of farm output value is produced under linkage contracts (2025) — buyers want to know which plot it came from[1]
0.5–0.6%
of vegetable area is VietGAP-certified; paperwork is the costliest part[4]
40–45%
nitrogen use efficiency (phosphorus 25–30%) — feeding without per-plot norms wastes fertiliser[7]
Current problems
No one knows which plot is at which stage
Many plots, many people; the spray and feeding calendar lives in the crew lead's head.
Certification paperwork starts from scratch each season
Paper diaries, photos on personal phones, invoices in a drawer.
No profit or loss per lot
Inputs, labour and yield aren't tied to plots, so you only see the yearly total.
Feeding by feel
Without norms per crop and stage, some plots get too much and others too little.
How NextFarm solves it
One concrete answer per problem, and where to find it in the app.
What it does
Map
Draw plots, measure area, assign growers
Draw on satellite imagery or import existing map files. Each plot records crop, area and responsible grower.
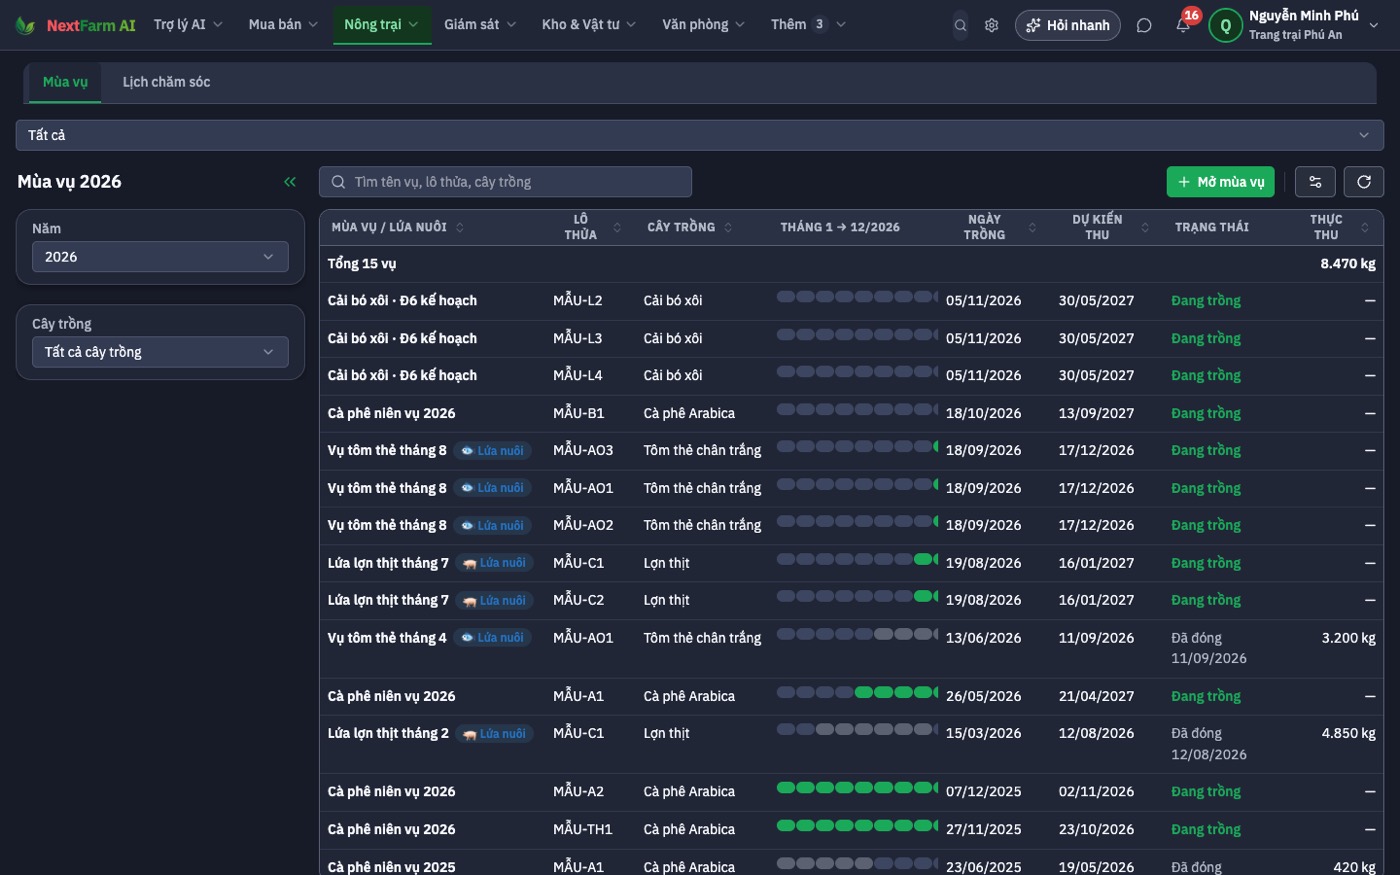
Seasons & logs
A timeline per season
Open a season on a plot, assign tasks with photo proof, log spraying, feeding, irrigation. Herd books for livestock, pond logs for aquaculture.
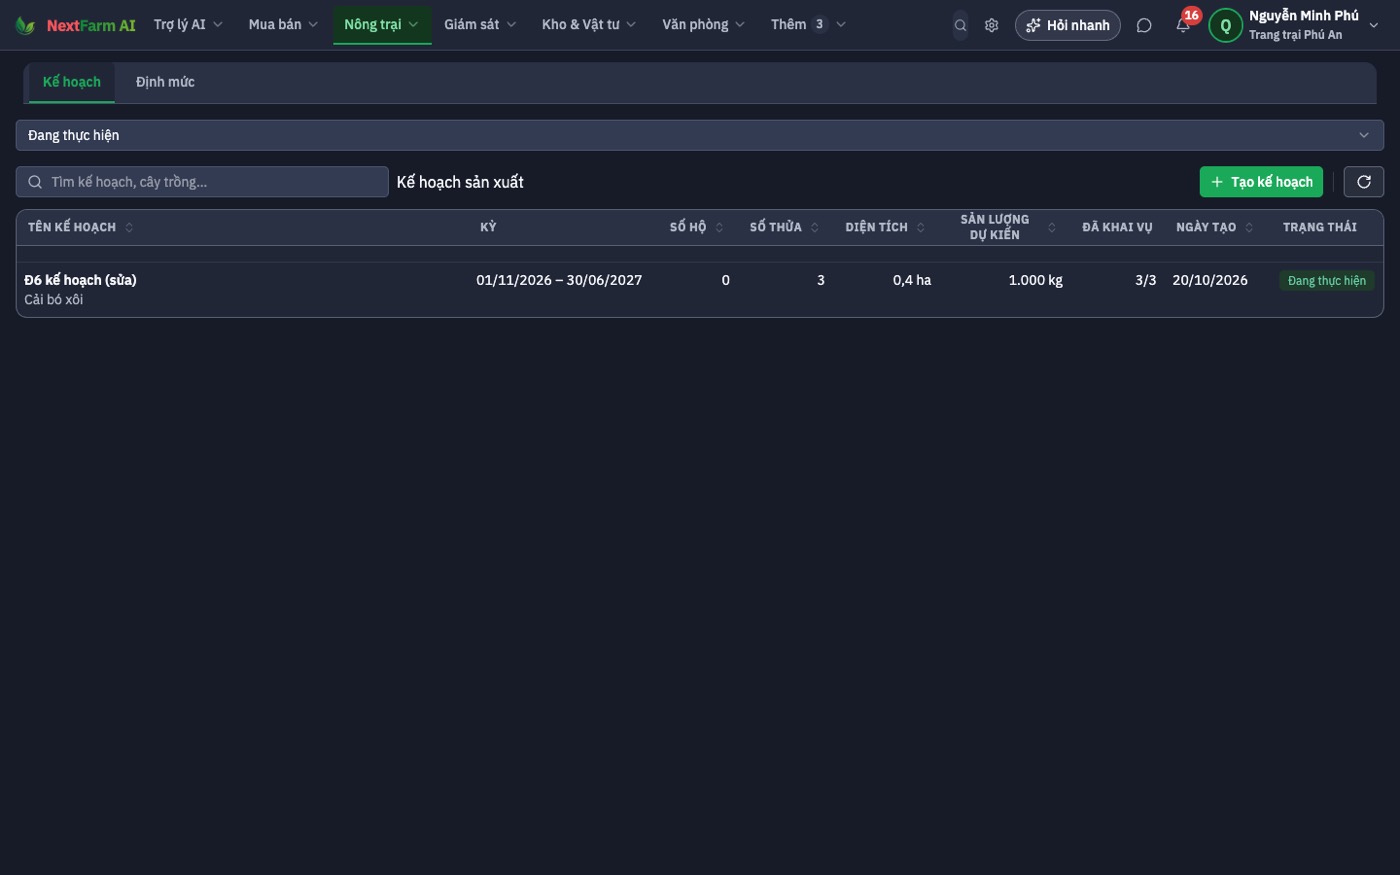
Plans & costing
Input norms, expected yield
Plan production by norms; after harvest, compare with actuals and get the cost of each lot.
Scenario: One melon season in 6 greenhouses
Week 0
Draw 6 greenhouses, open "Spring melon 2026", pick a 4-stage protocol with feeding norms per stage.
Daily
Workers log irrigation, spraying and pruning in the app, even without signal.
Week 6
Progress shows greenhouse 4 a week behind; the assistant suggests reviewing irrigation.
Harvest
Record yield per greenhouse; cost = inputs + labour + depreciation; print QR labels for the lot.
What you can measure after a season
The software doesn't promise yields; it gives you numbers to compare before and after.
Quick answers
Try it on your own farm
14-day Pro trial; your data stays when you pick a plan.